
Setting up the formatting options turns out to be the most fiddly bit of developing a custom visual. There are a few “special” property names that are required to trigger some behaviours, undocumented features and at least one bug that I’ve come across. In this section I’ll explain how the options are set up for the Tree Funnel visual and in an extra post I’ll talk about some of the other issues and features.
The complete code used in this section is available on GitHub.
Here are the formatting options I want for the Tree Funnel organised into 5 property groups.
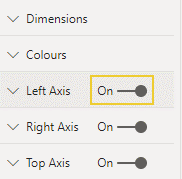
Here are the properties in Dimensions, Colours and one Axis group (the others are the same).
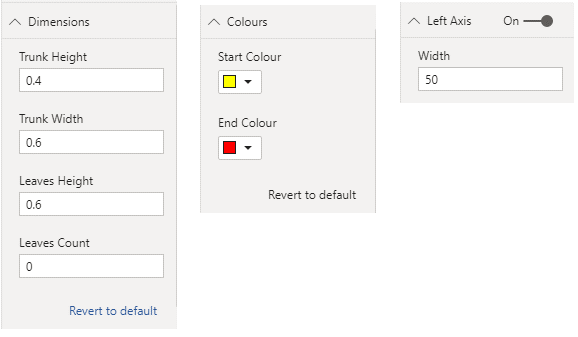
The dimension options express the size of the element as a ratio of the whole chart and therefore need to be implemented with max and min values. These will be fixed ranges. For the leaves count (the number of datapoints that will be displayed as leaves in the chart) the min is 0 but the max will be the number of data points in the data supplied to the visual so this range will need to be set based on the dataview data.
To set these up we need to:
- Define the groups and properties in the Capabilities JSON file
- Define classes to hold the property values
- Add a property to keep track of the current values
- Implement the enumerateObjectInstances method of the Visual
Define the groups and properties in the Capabilities File
All formatting groups and properties need to be defined in the capabilities.json file. In the file there is a top level object called objects that defines a collection of objects (which are the property groups) and each object defines a collection of properties that are the formatting properties. The basic structure is:
    "objects": {

        "myObject1": {
            "displayName": "",
            "properties": {
                "myProperty1": {
                    "displayName": "",
                    "description": "",
                    "type": {
                        ...
                    }
                }
            }
        }
    },
Each object needs a name and display name which shows in the property pane and for each property a type must be defined which controls how the property is rendered in the property pane. The types I need for my settings are:
//Numeric - renders on the property pane as a text box for numeric entry only
"type": { "numeric": true }

//Fill - renders as a colour picker
"type": { "fill": { "solid": { "color": true}}}

//Bool - renders as a switch
"type": { "bool": true }
Here is the JSON for my first property group Dimensions.
    "objects": {

        "dimensions": {
            "displayName": "Dimensions",
            "properties": {
                "trunkWidth": {
                    "displayName": "Trunk Width",
                    "description": "The width of the trunk.",
                    "type": {
                        "numeric": true
                    }
                },
                "trunkHeight": {
                    "displayName": "Trunk Height",
                    "description": "The height of the trunk.",
                    "type": {
                        "numeric": true
                    }
                },
                "leavesHeight": {
                    "displayName": "Leaves Height",
                    "description": "The height of the leaves.",
                    "type": {
                        "numeric": true
                    }
                },
                "leavesCount": {
                    "displayName": "Leaves Count",
                    "description": "The number of items to terminate as leaves.",
                    "type": {
                        "numeric": true
                    }
                }
            }
        },
And for the Colours group.
        "colours": {

            "displayName": "Colours",
            "properties": {
                "startColour": {
                    "displayName": "Start Colour",
                    "description": "Start colour.",
                    "type": {
                        "fill": {"solid": {"color":true}}
                    }
                },
                "endColour": {
                    "displayName": "End Colour",
                    "description": "End colour.",
                    "type": {
                        "fill": {"solid": {"color":true}}
                    }
                }
            }
        }
The axis groups will each have an on/off switch for the whole group. This is implemented by defining a property in a group with the name “show” with a type of bool . This is one of those uses of a “special value” that I heartily dislike. Here’s the JSON for the left axis group:
        "leftAxis": {

            "displayName": "Left Axis",
            "properties": {
                "show": {
                    "displayName": "Show",
                    "type": {
                        "bool": true
                    }
                },
                "leftAxisWidth": {
                    "displayName": "Width",
                    "description": "The width of the left axis.",
                    "type": {
                        "numeric": true
                    }
                }
            }
        }
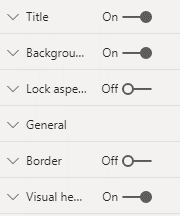
The other axis groups take a similar form. And that’s the capabilities bit done. By the way there are a standard set of formatting options that are displayed for every visual. Including any objects definition in capabilities will cause these to be displayed, even an empty collection.
"objects": {}
However if no objects definition is supplied none of these standard options will appear.
Define classes to hold the property values
Next we need to create a class which can be used to bind the property values to. These will be defined in settings.ts. One class per property group is required. And each class has one property for each property in the group. The property names here must match the property names in the capabilities file and must be initialised to a default value of the correct type. The dimensions class will look like this:
export class DimensionsSettings {

  //the property names must match the object property names in capabilities.josn
  public trunkHeight: number = .4;
  public trunkWidth: number = .6;
  public leavesHeight: number = 1;
  public leavesCount: number = 1;
}
For the colour properties the datatype should be set to string and the default value should be a hex colour value. Other formats may work but HTML / CSS colour names do not. So the colour class will be:
export class ColoursSettings {

  //the property names must match the object property names in settings.ts
  public startColour: string = "#ffff00";
  public endColour: string = "#ff0000";
}
For the axis groups the show property datatype should be bool and it will default to true. For example:
export class LeftAxisSettings {

  public show: boolean = true;
  public leftAxisWidth: number = 25;

}
Finally we create a class that extends DataViewObjectsParser. Essentially this utility class provides a simple way to access the values of the properties in the formatting pane. For now all we need to know is that the class requires a property for each property group (objects) defined in the capabilities.json file. These property names must match the object names in capabilities. And be set to the appropriate property group class as defined above. So, for the five property groups:
export class VisualSettings extends DataViewObjectsParser {

  //the property names must match the object names in capabilities.json
  public dimensions: DimensionsSettings = new DimensionsSettings();
  public colours: ColoursSettings = new ColoursSettings();
  public leftAxis: LeftAxisSettings = new LeftAxisSettings();
  public topAxis: TopAxisSettings = new TopAxisSettings();
  public rightAxis: RightAxisSettings = new RightAxisSettings();
}
Those are all the classes required. So in settings.ts I remove any existing code after the licence information and “use strict”. Add in an import for the DataViewObjectsParser and the classes discussed.
import { dataViewObjectsParser } from "powerbi-visuals-utils-dataviewutils";
import DataViewObjectsParser = dataViewObjectsParser.DataViewObjectsParser;
Add a property to keep track of the current values
In the visual.ts file I’ll add a new property to the Visual class that will hold the current settings’ values.
private visualSettings: VisualSettings;
Implement the enumerateObjectInstances method
None of the work so far will actually cause any of the Tree Funnel options to be displayed. In order for this to happen the method enumerateObjectInstances must be implemented for the Visual class. It is only here that the formatting options are rendered.
This method is called only when the formatting pane for the visual is active in Power BI. It’s triggered when the pane gets focus or a setting is changed. It is called once for every object defined in capabilities. So for the Tree Funnel it will fire five times. The method is called with a single parameter options that provides access to the name of the object it is being called for. Here’s a minimal implementation:
    public enumerateObjectInstances(options: EnumerateVisualObjectInstancesOptions): VisualObjectInstanceEnumeration {

        var settings: VisualSettings = this.visualSettings;
        var enumeratedObjects: VisualObjectInstanceEnumerationObject = <VisualObjectInstanceEnumerationObject>VisualSettings.enumerateObjectInstances(settings,options);
        return enumeratedObjects;
    }
The method returns an object of type VisualObjectInstanceEnumerationObject which contains all the information for Power BI to render the format pane properties object. You could construct this object from scratch but that would make all the messing around in capabilities redundant. Instead we can call the enumerateObjectInstances static method of VisualSettings (which inherits this method from DataViewObjectsParser) to generate this object. If you examine the object instances you’ll see the many details that will be familiar from the capabilities json.
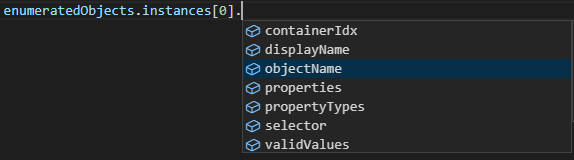
This is enough to display the options but I need to modify the enumerated objects to add in the min and max values for some settings. This is done by setting the validValues property but it’s a little strange to me that this option is not exposed when defining the object in the capabilities file. The validValues property takes the following form:
{
  myProperty1: { numberRange: { min: 0, max: 1 } },
  myProperty2: { numberRange: { min: 0, max: 1 } },
}
Where the property names must match a property name in the capabilities file. Here is the code for the dimensions object properties:
        if (options.objectName === "dimensions") {

            enumeratedObjects.instances[0].validValues = {
                trunkWidth: { numberRange: { min: 0.2, max: 0.8 } },
                trunkHeight: { numberRange: { min: 0.2, max: 0.8 } },
                leavesHeight: { numberRange: { min: 0.2, max: 1 } },
                leavesCount: { numberRange: { min: 0, max: this.trunnelItems.itemCount } }

            };
        }
All straightforward except leavesCount which takes the total number of data points from trunnelItems as the max value.
Getting Formatting Settings from the Dataview
Now Power BI will display these options and record the user selections. These are then stored in the visual dataview but the API provides some utils so that you don’t have to read the dataview directly. First I’ll set the visualSettings property in the Visual constructor using the getDefault static method of VisualSettings. This populates visualSettings with the default values.
this.visualSettings = <VisualSettings>VisualSettings.getDefault();
Next in the Visual update method I’ll update the visualSettings to the current settings by using the parse static method of VisualSettings which extracts the settings from the dataview:
this.visualSettings = VisualSettings.parse<VisualSettings>(dataView);
Now I can use visualSettings to replace the hardcoded values in the D3 code:
        var yAxisWidth = this.visualSettings.leftAxis.leftAxisWidth;
        var yLeavesAxisWidth = this.visualSettings.rightAxis.rightAxisWidth;
        var xAxisHeight = this.visualSettings.topAxis.topAxisHeight;


        var trunkHeightPercent = this.visualSettings.dimensions.trunkHeight;

        var trunkWidthPercent = this.visualSettings.dimensions.trunkWidth;
        var leavesHeightPercent = this.visualSettings.dimensions.leavesHeight;

        var colourScale = d3.scaleLinear<string, number>()
            .domain([0, items])
            .range([this.visualSettings.colours.startColour, this.visualSettings.colours.endColour]);
Updating the Data Extraction Method
Finally I need to update the Data Extraction function which currently has a hardcoded number for the number of data points to treat as leaves. I can now update this to use the Leaves Count property.
let leavesCount: number = this.visualSettings.dimensions.leavesCount;
Running the visual now should allow full control of the visual dimensions and colours. If a property has a valid range of values entering a value outside this range is permitted but the value is ignored and the property field is highlighted in the formatting pane. The Revert to default button will reset all values in a property group to their default values.
As I said at the start, I found this the most unintuitive and tricksy part of visual development. In subsequent posts I’ll discuss some of the vagaries in a bit more detail.