
A weighted bridge table approach
A classic many to many relationship problem is students enrolled on a course with multiple pathways such a joints or major minors. Say we have a major minor course where the two elements are taught in different schools it might look like this in a courses dimension.
| Course | Pathway | School |
|---|---|---|
| AB with BM | ANIMAL BIOLOGY | Biological sciences |
| AB with BM | BUSINESS MANAGEMENT | Business School |
Students are enrolled on a course not a pathway so clearly there will be a many to many relationship between enrolments and courses which is not permitted in Analysis Services. Before embarking on a solution it’s worth considering how we want measures to work at the school level. If we want to count students by school there are a least three options for dealing with enrolments across schools.
-
- Count a student as being in both schools. This is fair as they are studying in both schools but if we sum this measure across all schools we’ll get more than the total number of students. It also doesn’t reflect the work load the student has for the school.
- Assign a proportion of each student to each school. If the proportions add up to one this will give a true total of students across all schools but won’t tell a school the actual number of students.
- Choose one school to be the owner of the students for example the school running the major. This is not such an easy choice if the course is a joint!
The fact is all these approaches may be useful in different use cases so we’ll implement all three as different measures. The first step is to eliminate the many to many relationship. This is done by building a bridge table which is just a list of unique course codes. This is trivial to create in DAX as a calculated table derived from the courses dimension table:
Courses Bridge =values('Courses'[course_code])
This table the acts as a bridge between the Enrolments and Courses table – effectively converting one many to many relationship to a many to one and a one to many.
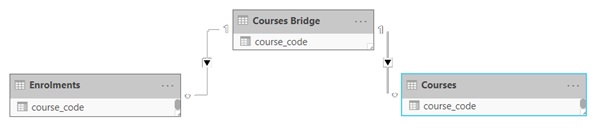
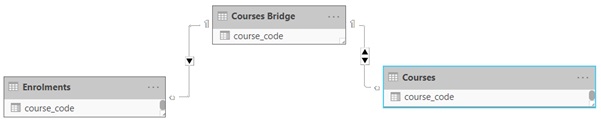
The relationship between Courses Bridge and Course will also have to be made bi-directional. As it’s currently set up filters cannot propagate from Courses to the Enrolments fact table.
Before we can define the measures we need to add couple of columns to the Courses dimension. Pathway FTE and Pathway Primary will define how a student should be apportioned for cases 2 and 3 above. Both values need to sum to 1 for each Course.
| Course | Pathway | School | Pathway FTE | Pathway Primary |
|---|---|---|---|---|
| AB with BM | ANIMAL BIOLOGY | Biological Sciences | 0.67 | 1 |
| AB with BM | BUSINESS MANAGEMENT | Business School | 0.33 | 0 |
The three measures can then be defined as follows.
--Count a student as being in both schools
--Count all rows in enrolments
Count Enrolments = COUNTROWS(Enrolments)

--Assign a proportion of each student to each school
--Use SUMX to apportion enrolments by the Pathway FTE
Count FTE = sumx(Courses, [Count Enrolments] * Courses[Pathway FTE])

--Choose one school to be the owner
--Use SUMX to apportion enrolments by the Pathway Primary
Count Primary = sumx(Courses, [Count Enrolments] * Courses[Pathway Primary])
Showing a student enrolment on a Major Minor course by School would give the following. Count Enrolments puts the student in both schools and the total for all schools is more than the total. Count FTE splits the student and Count Primary puts them in just one school – both measures sum up to the total number of students.
| School | Count Enrolments | Count FTE | Count Primary |
|---|---|---|---|
| Biological sciences | 1 | 0.67 | 1 |
| Business School | 1 | 0.33 | 0 |
| Total | 1 | 1 | 1 |
Alternative Approaches
Power BI (as of July 2018) supports many to many joins so the bridge used here can be replaced with a direct join. There are some limitations associated with this approach it is worth understanding. The measures would be defined in the same way.
Another approach would be to eliminate the many to many relationship by changing the granularity of enrolments table so the grain is enrolment per pathway rather than enrolment. The different measures can then be held on the enrolments table eliminating the need for the expensive SUMX operations. The downsides are the increase in ETL complexity, increase in the fact table size and a less intuitive grain.