
Having defined a timetable fact table and a timetable calendar dimension in previous articles I’ll now consider a particular reporting use case. I want to identify students who are timetabled for more than a certain number of hours per day. I want two measures here. The number of students who exceed X hours teaching in any single day and the number of days where each student exceeds this total. Using a timetable like this I can summarise the data at student / day level in SQL and add it to the Power BI model or create it in DAX as a calculated table. This will let me define the measures I want.
select t.student_number
,      cast(t.time_slot_start as date) start_date
,      sum(t.duration_in_minutes) duration_in_minutes
from   t.timetable t
group by t.student_number
,      cast(t.time_slot_start as date)
The downside is it restrictive in a couple of ways. First if I want to consider slightly different cases such as the number of hours scheduled in the evening I can modify the summary table to add the additional calculation but it would be nice to let the user define the criteria in the report.
select	student_number
,		cast(asts.time_slot_start as date) start_date
,		sum(15.0)/60.0 [hours]
,		sum(
			case
				when cast(asts.time_slot_start as time) between '18:00' and '22:00' then 15.0
				else 0.0
			end
			) / 60.0 hours_evening
from   staging.tt.activity_student_time_slots asts
group by student_number
,      cast(asts.time_slot_start as date)
Secondly since the table is aggregated to the student/date level it can’t be filtered by any dimension that is more granular than this. Again restricting what the user can do in the report. Ideally I’d want measures based directly on the granular timetable table but this is, at best, going to result in some very messy, slow calculations. However I can achieve a pretty decent solution with a couple of simple measures and the matrix visual. Defining measures on the detailed timetable table as follows:
Duration = sum('timetable'[duration_in_minutes])

Count Students = DISTINCTCOUNT('timetable'[student_number])

Count Dates = DISTINCTCOUNT('timetable'[time_slot_date])
Note I’ve added to the field time_slot_date (cast(t.time_slot_start as date)) to the timetable to save a cast in the measure. Adding these values and student number and time slot date to a matrix:
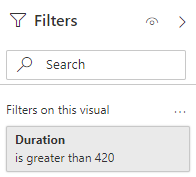
And adding a filter on duration that will return all days for all students where that day exceeds that duration.
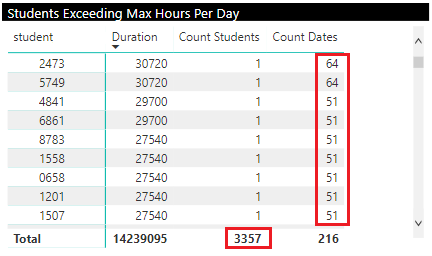
The Duration filter is applied by Power BI at the most granular level of the matrix (student / time slot date) not the level the matrix is summarised to so this works regardless of the drill down level of the matrix. Without any drill down the matrix will show the number of students who have any days that exceed the specified duration in the grand total of Count Students. And the number of days each student exceeds it in the Count Dates column.
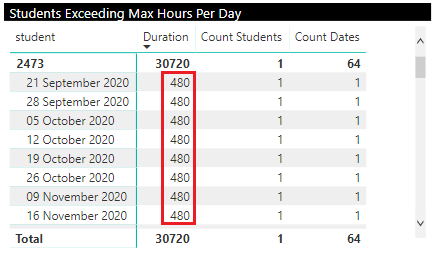
Drilling down provides the actual hours per day for each day exceeding the target:
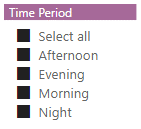
The user can adjust the duration filter to change the target and can apply any other filters to the timetable – for example specify targets for hours in particular portions of the day.
There are some downsides to this approach:
- It’s tied to using the matric visual only.
- The matrix contains some redundant or meaningless data – for example the duration is only useful at the student / date level. And the Count Students is only useful at the grand total level.
- Requiring the user to update a filter to adjust a parameter is not ideal.
However I think the flexibility for report users to define different scenarios without amending the report combined with the simplicity of the model is worth the costs.