
In a previous article on the PowerBI shape map I noted that you can use this visual to create a map of any shapes you like, for example, a campus building map, rooms withing buildings or pretty much anything else. All you need is a shape file that defines the regions of the objects you want to map. Here I’ll show how you could create a visual showing room utilisation.
If you have a building layout in SVG format (or that can be converted to SVG) you could use that but, for this example, I’ll create a new SVG picture of the rooms. I used an online SVG editor to do this but any application that can export SVG will do. My basic room map is just five rectangles.
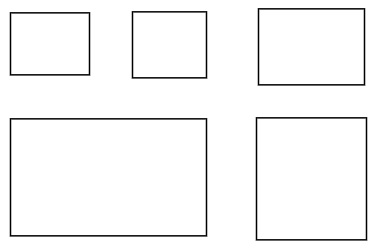
Exported as SVG the file looks something like this.
<svg width="580" height="400" xmlns="http://www.w3.org/2000/svg">
 <!-- Created with Method Draw - http://github.com/duopixel/Method-Draw/ -->
 <g>
  <title>background</title>
  <rect fill="#fff" id="canvas_background" height="402" width="582" y="-1" x="-1"/>
  <g display="none" overflow="visible" y="0" x="0" height="100%" width="100%" id="canvasGrid">
   <rect fill="url(#gridpattern)" stroke-width="0" y="0" x="0" height="100%" width="100%"/>
  </g>
 </g>
 <g>
  <title>Layer 1</title>
  <rect id="svg_1" height="62" width="79" y="77.85" x="52.5" stroke-width="1.5" stroke="#000" fill="#fff"/>
  <rect id="svg_2" height="66" width="74" y="76.85" x="174.5" stroke-width="1.5" stroke="#000" fill="#fff"/>
  <rect id="svg_3" height="76" width="106" y="73.85" x="300.5" stroke-width="1.5" stroke="#000" fill="#fff"/>
  <rect id="svg_4" height="117" width="196" y="183.85" x="52.5" stroke-width="1.5" stroke="#000" fill="#fff"/>
  <rect id="svg_5" height="122" width="110" y="182.85" x="298.5" stroke-width="1.5" stroke="#000" fill="#fff"/>
 </g>
</svg>
Convert SVG to GeoJSON
The next step is to convert the SVG into a geographic format – specifically GeoJSON. SVG has no geographical information associated with it (it’s just a bunch of drawing elements) so we need to place these somewhere in the real world. Since we’re just leveraging the shape map visual to display our custom building map we don’t care where in the world it is so I’ll place it at lat,long 0,0. We also need to scale it – again its real size does not matter but I’ll scale it so it’s roughly building size.
The site mygeodata has a converter that will take care of all these conversions. In order to use it we need to add in the location and scaling information to the SVG file. Add the following element as the first child of the SVG tag.
<MetaInfo xmlns="http://www.prognoz.ru">
<Geo>
<GeoItem X="0" Y="0" Latitude="0.001" Longitude="-0.001"/>
<GeoItem X="580" Y="580" Latitude="-0.001" Longitude="0.001"/>
</Geo>
</MetaInfo>
This maps the point 0,0 on the SVG to the location 0.001,-0.001 and the point 580,580 to the location -0001,0.001. This roughly centres the SVG on equator at 0 longitude and gives it size of about 200m. We also need to remove the background element from SVG. The resulting file for conversion is:
<svg width="580" height="400" xmlns="http://www.w3.org/2000/svg">
<MetaInfo xmlns="http://www.prognoz.ru"><Geo><GeoItem X="0" Y="0" Latitude="1" Longitude="-1"/><GeoItem X="1000" Y="1000" Latitude="-1" Longitude="1"/></Geo></MetaInfo>
 <g>
  <title>Layer 1</title>
  <rect id="svg_1" height="62" width="79" y="77.85" x="52.5" stroke-width="1.5" stroke="#000" fill="#fff"/>
  <rect id="svg_2" height="66" width="74" y="76.85" x="174.5" stroke-width="1.5" stroke="#000" fill="#fff"/>
  <rect id="svg_3" height="76" width="106" y="73.85" x="300.5" stroke-width="1.5" stroke="#000" fill="#fff"/>
  <rect id="svg_4" height="117" width="196" y="183.85" x="52.5" stroke-width="1.5" stroke="#000" fill="#fff"/>
  <rect id="svg_5" height="122" width="110" y="182.85" x="298.5" stroke-width="1.5" stroke="#000" fill="#fff"/>
 </g>
</svg>
Load this file into the mygeodata converter and download the geoJSON file. This file defines each SVG rectangle (room) as a map feature. Each feature has properties (none at present) that we’ll use to add keys to each feature (room). Open the file in a text editor.
{
"type": "FeatureCollection",
"creator": "svg2geojson v0.7.0",
"name": "building_map_geo",
"features": [
{ "type": "Feature", "properties": { "properties": null }, "geometry": { "type": "Polygon", "coordinates": [ [ [ -121.97179, 37.373959 ], [ -121.97179, 37.373501 ], [ -121.971058, 37.373501 ], [ -121.971058, 37.373959 ], [ -121.97179, 37.373959 ] ] ] } },
{ "type": "Feature", "properties": { "properties": null }, "geometry": { "type": "Polygon", "coordinates": [ [ [ -121.970659, 37.373967 ], [ -121.970659, 37.373478 ], [ -121.969973, 37.373478 ], [ -121.969973, 37.373967 ], [ -121.970659, 37.373967 ] ] ] } },
{ "type": "Feature", "properties": { "properties": null }, "geometry": { "type": "Polygon", "coordinates": [ [ [ -121.969491, 37.373989 ], [ -121.969491, 37.373427 ], [ -121.968508, 37.373427 ], [ -121.968508, 37.373989 ], [ -121.969491, 37.373989 ] ] ] } },
{ "type": "Feature", "properties": { "properties": null }, "geometry": { "type": "Polygon", "coordinates": [ [ [ -121.97179, 37.373175 ], [ -121.97179, 37.372309 ], [ -121.969973, 37.372309 ], [ -121.969973, 37.373175 ], [ -121.97179, 37.373175 ] ] ] } },
{ "type": "Feature", "properties": { "properties": null }, "geometry": { "type": "Polygon", "coordinates": [ [ [ -121.96951, 37.373182 ], [ -121.96951, 37.37228 ], [ -121.96849, 37.37228 ], [ -121.96849, 37.373182 ], [ -121.96951, 37.373182 ] ] ] } }
]
}
For each feature replace { “properties”: null } with { “room_id”: 1 }, { “room_id”: 2 } etc. Here’s the final file.
{
"type": "FeatureCollection",
"creator": "svg2geojson v0.7.0",
"name": "building_map_geo",
"features": [
{ "type": "Feature", "properties": { "room_id": 1 }, "geometry": { "type": "Polygon", "coordinates": [ [ [ -121.97179, 37.373959 ], [ -121.97179, 37.373501 ], [ -121.971058, 37.373501 ], [ -121.971058, 37.373959 ], [ -121.97179, 37.373959 ] ] ] } },
{ "type": "Feature", "properties": { "room_id": 2 }, "geometry": { "type": "Polygon", "coordinates": [ [ [ -121.970659, 37.373967 ], [ -121.970659, 37.373478 ], [ -121.969973, 37.373478 ], [ -121.969973, 37.373967 ], [ -121.970659, 37.373967 ] ] ] } },
{ "type": "Feature", "properties": { "room_id": 3 }, "geometry": { "type": "Polygon", "coordinates": [ [ [ -121.969491, 37.373989 ], [ -121.969491, 37.373427 ], [ -121.968508, 37.373427 ], [ -121.968508, 37.373989 ], [ -121.969491, 37.373989 ] ] ] } },
{ "type": "Feature", "properties": { "room_id": 4 }, "geometry": { "type": "Polygon", "coordinates": [ [ [ -121.97179, 37.373175 ], [ -121.97179, 37.372309 ], [ -121.969973, 37.372309 ], [ -121.969973, 37.373175 ], [ -121.97179, 37.373175 ] ] ] } },
{ "type": "Feature", "properties": { "room_id": 5 }, "geometry": { "type": "Polygon", "coordinates": [ [ [ -121.96951, 37.373182 ], [ -121.96951, 37.37228 ], [ -121.96849, 37.37228 ], [ -121.96849, 37.373182 ], [ -121.96951, 37.373182 ] ] ] } }
]
}
The PowerBI shape map requires a TopoJSON format not geoJSON so there’s one more conversion to do. Use the MapShaper site to upload the geoJSON file and export it as TopoJSON. This file is now ready for use in Power BI
Add to PowerBI Shape Map
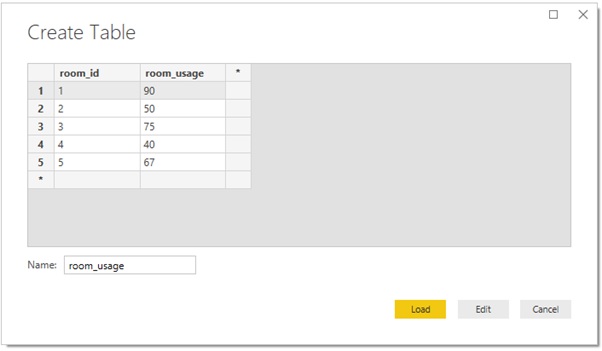
To demonstrate this shape map first add some data to Power BI for the room IDs defined in the properties we added above.
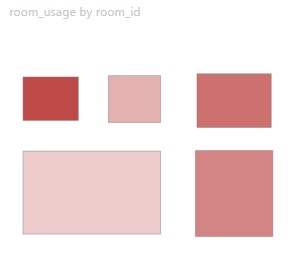
Then add a shape map visual to the report. In the visual fields add the room_id to the Location and room_usage to the Colour saturation. In the visual formatting under Shape click Add map and select the TopoJSON file we generated above. The result should look something like this:
Projections
When the map is drawn it will potentially be distorted by the projection that is used to project the latitudes and longitudes onto locations on the flat plane of the visual. If we use the scaling above however and the Equirectangular projection for the shape map this will retain the shape of the original drawing. Also, because the scale of the objects is relatively small and they are positioned at the equator, the other projections should not distort the shape significantly.
Alternative Approaches
This is a somewhat roundabout process and there are certainly tools out there that will streamline the process. There is also at least one visual which let’s you produce custom maps of this type – the Synoptic Panel by OKVis. I’ve not spent much time with this product but when I have i’ll write it up in a bit more detail.