
Setting up a KPI to monitor performance against a single target is simple enough in SSAS (it’s also possible directly in Power BI but I’ll only deal with the SSAS approach here). However if you have different targets for different dimension values then a bit more thought is required. As an example imagine different courses are set different targets for student withdrawals in an academic year.
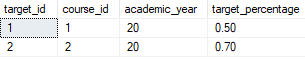
Here two courses each have a different target withdrawal rate (for ease of setting up test data I’ve defined some particularly atrocious rates!). If a course exceeds its target it should be red-flagged. But what if we want to aggregate the courses up to schools – what target do we set for the school based on the course targets. Two options spring to mind:
- Calculate a target for each school based on the target number of withdrawals for all the courses in this school. Effectively summing the maximum number of withdrawals allowed across all courses for their individual targets. A school could then have courses that miss individual targets so long as other courses make up the shortfall.
- Or if any course in a school misses its target then the school is also flagged.
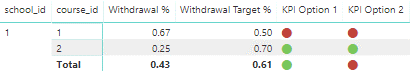
Below you can see the two options. Course 1 exceeds its target and Course 2 hits it. The school also hits a calculated target based on all courses in the school so Option 1 is green for the school, however Option 2 is red as at least on course in the school missed its target.
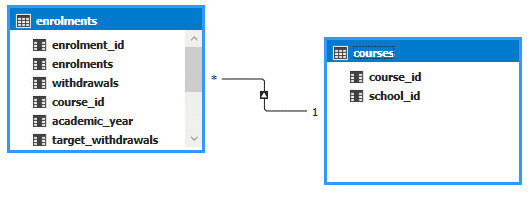
To show how this works I’ll set up a very simple data model. An enrolments fact table which has one record per student enrolment, a courses dimension that rolls up course to school and a table to hold targets for each course.
CREATE TABLE enrolments

(
enrolment_id INT
, enrolments INT
, withdrawals INT
, course_id INT
, academic_year INT
, target_withdrawals NUMERIC(3,2)
)


CREATE TABLE courses

(
course_id INT
, school_id INT
)


CREATE TABLE targets

(
target_id INT
, course_id INT
, academic_year INT
, target_percentage NUMERIC(3,2)
)
In the enrolments table I’ve included a column target_withdrawals which will hold the number of withdrawals not to exceed based on the course target. Since the grain of enrolments is one student this number will be a fraction of one student – in fact it will be the same as the target percentage. I’ll populate this before loading the data into SSAS.
UPDATE e
SET e.target_withdrawals = e.enrolments * t.target_percentage
FROM dbo.enrolments e
JOIN dbo.targets t
ON e.course_id = t.course_id
AND e.academic_year = t.academic_year
I could do this calculation on the fly in a DAX measure looking up to the targets table but I prefer to put the number on the fact table at load time as it keeps the measures a bit simpler and makes it clear that target_withdrawals is a fully additive measure. After building this simple model in SSAS I can add in some measures.
Adding measures for the Withdrawal % and Withdrawal Target %:
Withdrawal % := sum(enrolments[withdrawals]) / sum(enrolments[enrolments])

Withdrawal Target % := sum(enrolments[target_withdrawals]) / sum(enrolments[enrolments])
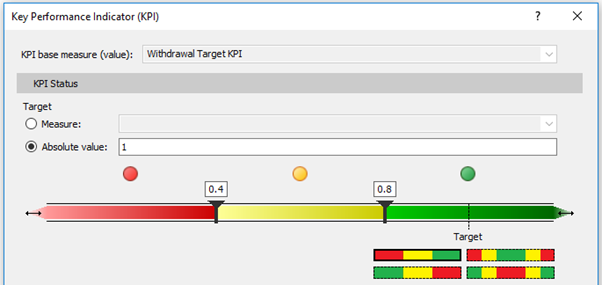
I can now set up the Option 1 type KPI. In the measure grid in SSAS right click on the Withdrawal % measure and select Create KPI. Select the target measure as Withdrawal Target %. When calculating the KPI status SSAS divides the Base Measure by the Target and maps the resulting percentage to Red/Amber/Green states. The sliders are used to specify the range of for each state.
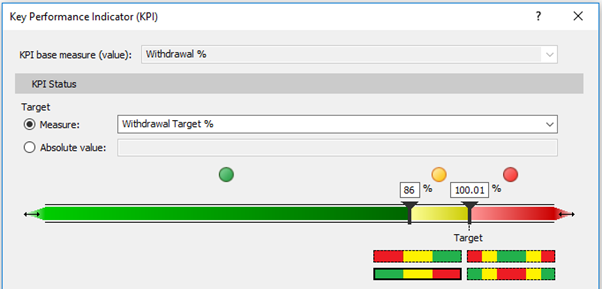
Here low is good so I select the Green/Amber/Red option. Also I only want Green or Red – I can fudge this by setting a very small range for amber (100% to 100.01% for example). Alternatively I can create a new measure that generates a binary value whether the target was hit.
Withdrawal Target KPI := SWITCH([Withdrawal %] > [Withdrawal Target %], true, 0, 1)
And create a KPI on this measure using an absolute value for comparison. Since the base measure will always be 1 or 0 there is no risk of hitting the amber zone.
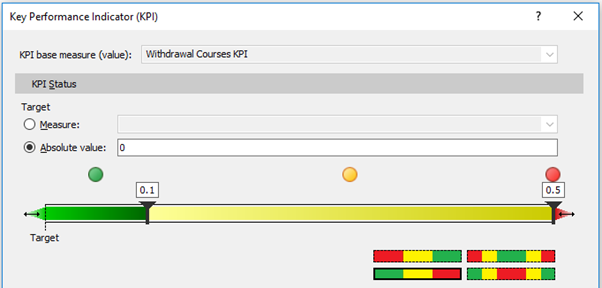
For Option two I need a new measure that counts the number of courses that exceed their target withdrawal rate. Here’s what I came up with.
Withdrawal Courses KPI :=

    IF(
        ISBLANK(
            COUNTROWS (
                DISTINCT (
                    SELECTCOLUMNS (
                        FILTER(
                            SUMMARIZE(enrolments, enrolments[course_id], "measure", enrolments[Withdrawal %], "goal", enrolments[Withdrawal Target %])
                            , [measure] > [goal])

                        , "col"
                        , [course_id] )
                        )
                    )
                )
        ,0
        ,1)
Yuck right? But it works so I’ll go with that for now. Got a better approach then let me know! Then I need to add a KPI to this measure. Here the target is 0 (no courses miss their target). Again because only integer values are possible for the measure there’s no chance of hitting amber.
When connecting from Power BI to the model I’ve built the measures which have KPIs attached will look like this.
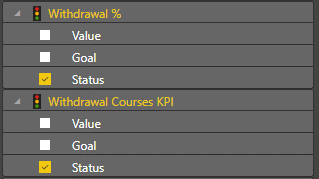
The value is the value of the measure on which KPI is based, the goal is the target (either the measure defined as the target or the absolute value) and the status renders as the Red/Amber/Green indicator. Putting these into a matrix visual gives what I was looking for.
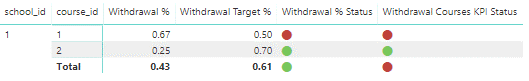
The school has two courses one of which failed to hit it’s target so the entire school fails on the withdrawal courses KPI. But course two exceeded its target enough to compensate for the course one withdrawals so the schools passes on the withdrawal % KPI.
There are a few quirks with SSAS KPIs but I’ll save those along with discussion on how KPIs can be implemented directly in a Power BI desktop model for another time.