
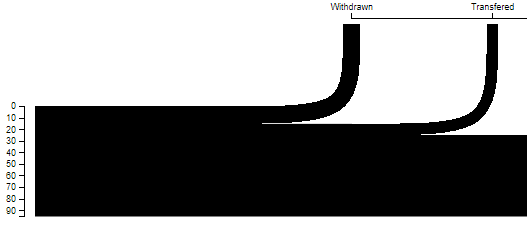
When drawing the paths for the Tree Funnel visual I noticed an unsightly line between each horizontal. Initially I thought this would be due to a small error in the stroke width introducing a gap but actually the calculation is perfect and each path is exactly adjacent. The lines are actually due to the anti-aliasing of each path.
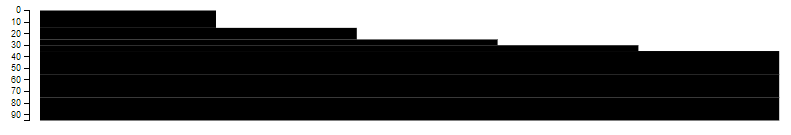
This happens when the shape rendering for the SVG is set to geometricPrecision (or auto most of the time) and anti-aliasing is used to give a nice smooth curve. Set the rendering to crispEdges and the problem goes away but then we’re left with ugly jagged curves. Here’s the crispEdges version:
.attr("shape-rendering", "crispEdges")
My first idea was to draw the horizontal and the curves as separate paths with crisp edges and then with geometric precision. But while that fixed the lines between the horizontals it introduced one at the join between the horizontal and the curve. Next I tried increasing the stroke size so the lines slightly overlap. The problem with this is that the amount of overlap required varies depending on how the image is scaled and the amount required to reliably cover the lines was becoming significant. I also looked into using mix blend modes – there may be a solution there but I couldn’t find it easily. Instead I opted to draw the horizontal lines separately rendered with crisp edges and then draw the whole path (horizonal and curve) again but with geometric precision. The crisp edges lines then covered the gaps in the geometric precision lines.
In my code I added a new function to return just the horizontal path.
        //Return a horizontal line for a data point.

        //This is just there to stop the appearance of blending lines.
        //It is otherwise identical to the horizontal portion of getLine below.
        var getHorizontal = function (d, i) {

            var xScalePosition = i;
            if (d.end) { var xScalePosition = branches; }

            var trunkPos = yScale(d.runSum + (d.value / 2)) + trunkTop;
            var moveToTop = "M 0, " + trunkPos + " ";
            var horizontalLine = "H " + xScale(xScalePosition) + " ";

            return moveToTop + horizontalLine;

        }
And after adding the whole line path add just the horizontals.
        // Set the path options and add the horizontal

        line.append("path")
            .attr("stroke", function (d, i) { return colourScale(i) })
            .attr("stroke-width", function (d) { return yScale(d.value) })
            .attr("fill", "none")
            .attr("shape-rendering", "crispEdges")
            .attr("d", getHorizontal);
I’m not entirely happy with this solution as it feels a bit hacky but it does fix this specific issue.