
An accumulating fact table has rows that represent a process and typically has dates (amongst other keys) that represent the time of completion of a stage in the process. For some calculations they are also a pain to deal with and where possible I like to convert them into transactional tables as well which makes solving these a lot simpler. Transaction tables represent a single measurement at a point in time which is immutable – it will never change. To take a very simple example consider a call logging table that contains the start and end of a call.
create table calls
(
	call_id int
,	start_on datetime
,	end_on datetime
)
With the data in this structure questions like what is the maximum number of concurrent calls are difficult to answer without iterating over the data set. Converting it to a transaction table will make these queries trivial.
The data in the table implies two types of transaction: Call Started and Call Ended. So we can create a transaction table with a record for each call start and call end event and include a measure that represents the change to the number of calls this event represents: that is 1 or -1.
create table call_transactions
(
	call_transaction_id int identity(1,1) primary key clustered
,	call_id int
,	transaction_type varchar(10)
,	transaction_date datetime
,	calls int
)
To populate this we need two records for each call record. This can be done by cross joining to a table with two rows (I’ll use the trusty integers table for this). One of the records will become the call start record and one the call end record.
insert into call_transactions
select	c.call_id
,		case when i.number = 1 then 'Call_Start' else 'Call_End' end transaction_type
,		case when i.number = 1 then c.start_on else c.end_on end transaction_date
,		case when i.number = 1 then 1 else -1 end calls
from	calls c
		cross join mis.mst.integers i
where	i.number <= 2
Producing a time series of concurrent calls now becomes a simple matter of creating a running sum of calls ordered by the transaction date. In SQL:
select	transaction_date
,		sum(calls) over (order by transaction_date asc) concurrent_calls
from	call_transactions
order by transaction_date
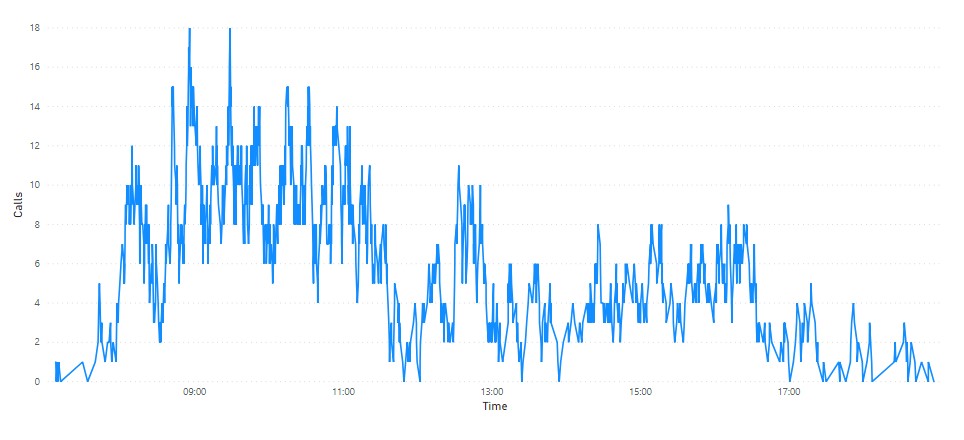
Or in DAX and plotted with some sample data in Power BI:
CALCULATE(
    SUM('call_transactions'[calls]),
    FILTER(
        ALLSELECTED('call_transactions'[transaction_date]),
        ISONORAFTER('call_transactions'[transaction_date], MAX('call_transactions'[transaction_date]), DESC)
    )
)
One downside here is that whatever window on the data we sum over must include both the start and end transaction of every call in that window. If we filter the data by day based on the transaction date a call which starts in one day and ends in the following day will be appear half in each day. This might cause the number of concurrent calls at the start of day two to be -1 which will not look good! This is easily solved by making an arbitrary choice about these boundary conditions – let’s say that any call belongs to the day that it started in – and apply these when we create the call transactions table in a new column that will be populated with the start date of the call.
, call_date datetime
Filtering on this date rather than the transaction date will then ensure that “whole” calls are included when slicing the data.
An Alternative Approach
Something similar can be produced using the original calls table by sampling the data at specific intervals. Create a table with a set of datetimes to be the points to check the number of concurrent calls, in SQL:
select	i.interval_date
,		count(*)
from	calls c
		join intervals i
		on i.interval_date between c.start_on and c.end_on
group by i.interval_date
The issue here is that the performance of this approach is much worse and the accuracy of the results is dependent on the granularity of the intervals. Furthermore the more intervals you add to improve accuracy the more the performance is degraded.