
Power BI provides some basic alerting that can be set up on dashboard tiles but for my use case there are some major issues. First they rely on the user to define the alert and I want to push notifications to users. Secondly implementing alerts based on specific users’ areas of concern (the courses or schools that they manage for example) would seem to require a specific dashboard for each user which is not tenable. Since my data is on premise in SSAS however I can go back down the stack to SQL Server where I can get a bit more control of the process. Here’s the basic functionality I’ll be delivering.
-
- Alert users when a measure goes outside a defined range. Don’t notify them again unless the measure changes.
- Allow users to define a dimension field for which the measure will be calculated (their area of concern).
- Mail alerts to users including a link to a Power BI report that is pre-filtered to their area of concern.
I’ll use SQL Server to manage the process, SQL Server Agent to schedule and Database Mail to send the notifications but I don’t want to rebuild all the calculations that are already defined in the SSAS Tabular Model that will trigger the alerts. Fortunately you can run the necessary DAX against the Tabular model in SQL Server by executing a pass through query with OPENQUERY. Steve Simon has a nice piece on this at SQL Shack . Basically you create a linked server to the Tabular server and execute a DAX query against it.
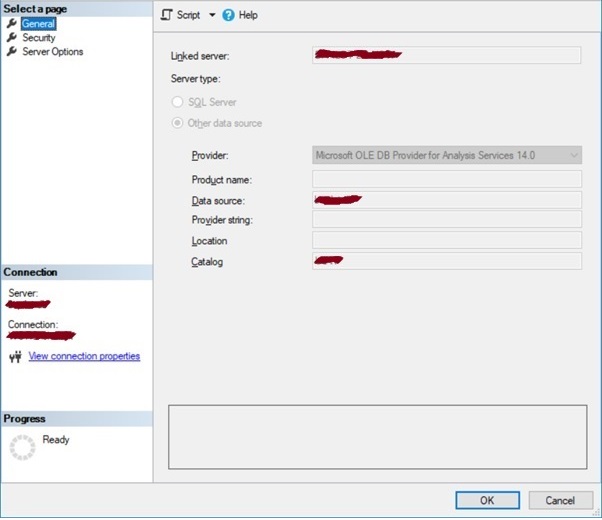
Here’s the linked server set up. The Data source is the Analysis Services server and the Catalog is the Analysis Services database:
You can then run a DAX query using Open Query against the linked server. This query will return withdrawal rates by department.
select	*
from	OPENQUERY([LINK_SERVER_NAME],
'	EVALUATE
		SUMMARIZE(		''Courses''
				,	''Courses''[department_name]
				,	"Withdrawal Rate"
				,	[Withdrawn YTD%]	)' )
OPENQUERY doesn’t support the use of variables for the query so in order to run different queries the whole command will have to be generated as a string and executed using EXEC. The DAX commands for each alert type will be saved in an Alerts table which will also define the acceptable range for the measure being tracked and the area of concern as well as the report URL to direct users to.
CREATE
TABLE 	alt.alerts
(
	alert_id int IDENTITY(1,1) primary key clustered
,	alert_name varchar(255) NULL
,	area_of_concern varchar(255) NULL
,	range_high decimal(18, 6) NULL
,	range_low decimal(18, 6) NULL
,	dax_query varchar(max) NULL
,	report_url varchar(1000) NULL
,	report_filter_table varchar(50) NULL
,	report_filter_field varchar(50) NULL
)
To start with I’ll define two alerts. Both tracking withdrawal rates but one at department level and one at course level. The report filter table and field define the column that will be filtered on for a user’s area of concern.
| Alert 1 | Alert 2 | |
|---|---|---|
| alert_id | 2 | 3 |
| alert_name | Departmental Withdrawal Rate | Course Withdrawal Rate |
| area_of_concern | Department | Course |
| range_high | 0.1 | 0.1 |
| range_low | 0 | 0 |
| dax_query | select * from OPENQUERY(... | select * from OPENQUERY(... |
| report_url | https://app.powerbi.com/… | https://app.powerbi.com/… |
| report_filter_table | Courses | Courses |
| report_filter_field | department_name | course_name |
I’ll use an Alert Subscriptions table to hold the users and the alerts they are subscribed to – the alert and the dimension value that defines their area of concern. It will also hold the current and last value for the alerted measure.
CREATE
TABLE	alt.alert_subscriptions(
	alert_subscription_id int IDENTITY(1,1) primary key clustered
,	alert_id int NULL
,	area_of_concern_value varchar(255) NULL
,	email varchar(255) NULL
,	current_metric_value decimal(18, 6) NULL
,	last_metric_value decimal(18, 6) NULL
)
And a couple of example alert subscriptions.
| Subscription 1 | Subscription 1 | |
|---|---|---|
| alert_subscription_id | 2 | 3 |
| alert_id | 2 | 3 |
| area_of_concern_value | School of Social Science | Politics |
| a.user@uni.ac.uk | a.user@uni.ac.uk | |
| current_metric_value | 0.116096 | 0.333333 |
| last_metric_value | 0.116096 | 0.333333 |
Finally a table to hold the results of the DAX queries. This is truncated every time the notification process is run so could be implemented as a temporary but in the future it will be used to keep a history of the query results.
CREATE TABLE [alt].[alert_metrics]
(
	alert_metric_id int IDENTITY(1,1) primary key clustered
,	alert_id int NULL
,	area_of_concern_value varchar(255) NULL
,	metric_value decimal(18, 6) NULL
)
Sending Alerts
All that’s required now is a stored procedure to run the DAX and generate the required notifications. The first step is to run through each alert and execute the DAX and record the results in the Alert Metrics table. A cursor is used to loop through each alert, execute the DAX and load it into the alert metrics table. Note that the DAX query gets all values for all possible areas of concern – the next steps will pick out those that have been subscribed to by users.
--temporary table to hold the DAX query results
create table #alert_metrics
(
	area_of_concern_value varchar(255)
,	metric_value decimal(18,6)
)


--the table to hold DAX query results
--here it is truncated every time the process is run
--but it could hold a history instead
truncate table alt.alert_metrics


--open a cursor for all the alerts to be run
declare @alert_id as int
declare @dax_query as varchar(max)

declare alert_cursor cursor
for
	select	alert_id
	,		dax_query
	from	alt.alerts

open alert_cursor
fetch next from alert_cursor
into @alert_id, @dax_query

--for each alert
while @@FETCH_STATUS = 0
begin


	--push the DAX results into temporary table
	insert into #alert_metrics
	exec(@dax_query)

	--push the results from the temporary table to the alert metrics table
	--adding in the alert ID
	insert into alt.alert_metrics
	select	@alert_id
	,		area_of_concern_value
	,		metric_value
	from	#alert_metrics

	--clear down the temporary table for the next alert
	truncate table #alert_metrics

	fetch next from alert_cursor
	into @alert_id, @dax_query

end

close alert_cursor
deallocate alert_cursor
Next the Alert Subscriptions table is updated based on the Alert Metrics to record the current metric value for each alert and area of concern value that users are subscribed to.
--update the subscriptions table with the current value
--for each alert and area of concern
update	asb
set		asb.current_metric_value = am.metric_value
from	alt.alert_metrics am
		join alt.alert_subscriptions asb
			on am.alert_id = asb.alert_id
			and am.area_of_concern_value = asb.area_of_concern_value
Then all the subscriptions whose metrics are outside the alert range and whose current metric value is different from their last metric value (so users not are spammed with the same alert) are identified and for each subscription an email is sent with a link to the appropriate Power BI report filtered by the area of concern value they subscribed to. This is done by attaching URL Parameters to the default report URL.
--open a cursor for each subscription where the metric is out of permitted range
--and the metric value has changed since the last alert run
declare @alert_name as varchar(255)
declare @report_url as varchar(1000)
declare @report_filter_table as varchar(50)
declare @report_filter_field as varchar(50)
declare @email as varchar(255)
declare @current_metric_value as decimal(18,6)
declare @area_of_concern_value as varchar(255)

declare aubscription_cursor cursor
for
	select	a.alert_name
	,		a.report_url
	,		a.report_filter_table
	,		a.report_filter_field
	,		asb.email
	,		asb.current_metric_value
	,		asb.area_of_concern_value
	from	alt.alert_subscriptions asb
			join alt.alerts a
				on a.alert_id = asb.alert_id
				and asb.current_metric_value not between a.range_low and a.range_high
				and (asb.current_metric_value != asb.last_metric_value or asb.last_metric_value is null)


open aubscription_cursor
fetch next from aubscription_cursor
into @alert_name, @report_url, @report_filter_table, @report_filter_field, @email, @current_metric_value, @area_of_concern_value


--for each subscription
while @@FETCH_STATUS = 0
begin

	--create the filtered report link
	declare @space as char(7) = '_x0020_'
	declare @report_url_filtered as varchar(1000)

	set @report_url_filtered =	@report_url
					+ '?filter='
					+ replace(@report_filter_table, ' ', @space)
					+ '/'
					+ @report_filter_field
					+ '%20' + 'eq' + '%20'
					+ '%27'
					+ replace(@area_of_concern_value, ' ', '%20')
					+ '%27'


	--generate emails with link to report
	EXEC msdb.dbo.sp_send_dbmail
		@profile_name = 'MIS EMail',
		@recipients = @email,
		@body = @report_url_filtered,
		@subject = @alert_name;


	fetch next from aubscription_cursor
	into @alert_name, @report_url, @report_filter_table, @report_filter_field, @email, @current_metric_value, @area_of_concern_value


end

close aubscription_cursor
deallocate aubscription_cursor
Finally the last metric value for each subscription is updated to the current value ready for the next run of the alert process.
--update subscription last metric value
update	alt.alert_subscriptions
set	last_metric_value = current_metric_value
Generating the DAX Query
Rather than write the DAX for each alert you can use the Performance Analyser on the target report in Power BI Desktop to grab the required queries. This both saves a bunch of work and ensures the alerts are in sync with the reports they will point to. One potential issue to watch out for is that the pass through query is less tolerant than it might be in Power BI. For example Power BI will return Infinity for divide by zero errors but this will cause an fatal error when running the same query via the MSOLAP OLE DB Provider so errors of this type will need to be handled in the DAX:
OLE DB provider 'MSOLAP' for linked server 'LINK_SERVER_NAME' returned invalid data for column '[MSOLAP].[Withdrawn_Headcount__]'