
The national student survey results are returned as a set of Excel workbooks that breakdown the responses by a variety of criteria – each workbook providing a different breakdown. By course, by age etc. This is fine but the structure makes it difficult to visualise the data in other tools and to compare the NSS metrics with other metrics about a category. For example NSS results vs attainment for a course. In order to support these functions I’ll need to restructure the data into a more BI friendly format. Because the data is anonymised and calculated differently for different categories it will never be possible to combine data from different categories. So I will just look at a single useful category – course.
Survey Target Structure
To start with I’ll define my target data structure. One fact table and two dimensions. The dimensions are survey_questions which will hold the questions asked in the survey and the survey_answers which will hold the answer options for each question. Because all questions have the same possible answers in the NSS we only need to define answers for the whole survey not per question:
| answer_id | answer_sequence | answer | answer_group_1 | answer_group_2 |
|---|---|---|---|---|
| 1 | 5 | Definitely Agree | Agree | Responded |
| 2 | 4 | Mostly Agree | Agree | Responded |
| 3 | 3 | Neither Count | Neither | Responded |
| 4 | 2 | Mostly Disagree | Disagree | Responded |
| 5 | 1 | Definitely Disagree | Disagree | Responded |
| 6 | 6 | Not Applicable | Not Applicable | Responded |
| 7 | 7 | Did Not Respond | Did Not Respond | Did Not Respond |
In addition I’ve included a Did Not Respond option to count students who did not respond to the survey at all. This will apply to all questions for survey non-responders. The questions dimension will have one record per question.
| question_id | question_sequence | question | question_group |
|---|---|---|---|
| 1 | 1 | Staff are good at explaining things. | The teaching on my course |
| 2 | 2 | Staff have made the subject interesting. | The teaching on my course |
| 3 | 3 | The course is intellectually stimulating. | The teaching on my course |
| 4 | 4 | My course has challenged me to achieve my best work. | The teaching on my course |
| 5 | 5 | My course has provided me with opportunities… | Learning opportunities |
The fact table will hold the number of responses to each question/answer combination for each course.
| question_id | answer_id | course_id | response_count |
|---|---|---|---|
| 1 | 1 | BSCPOL | 4 |
| 1 | 2 | BSCPOL | 7 |
| 1 | 3 | BSCPOL | 0 |
| 1 | 4 | BSCPOL | 0 |
| 1 | 5 | BSCPOL | 0 |
| 1 | 6 | BSCPOL | 0 |
| 1 | 7 | BSCPOL | 1 |
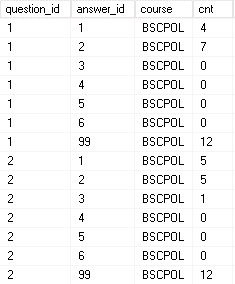
For example, in answer to question 1 four people selected answer 1, seven answer 2 and one did not respond to the survey. Now I have a target structure I can look at how to get the Excel data into it. Some of this is a bit manual but since it will only be done once a year that’s not a bit deal.
NSS Source Structure
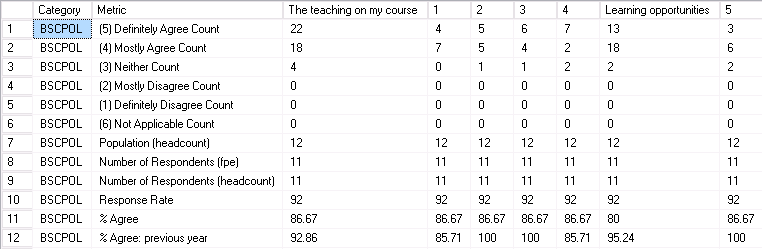
The NSS Excel data look like this: Category and Answer (as well as population which I’ll need to calculate non-responders) in the rows and questions in the columns. I don’t need the question groups (in yellow) because that’s already captured in the hierarchy in the questions dimension. And the actual question names in the column headings I’ve replaced with the question sequence number from the question dimension.
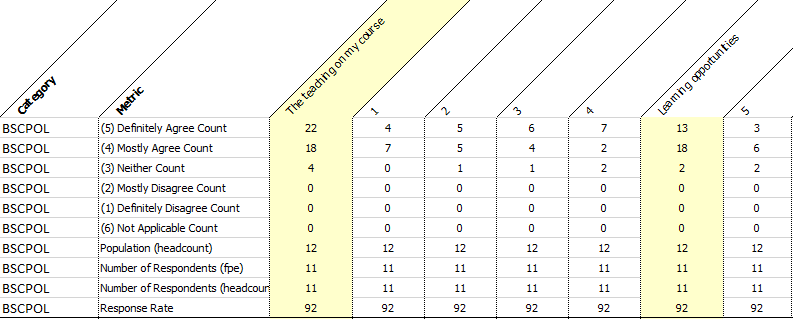
I’ll just import this in SQL Server as is so I can process it there. The resulting table nss_survey_2019:
Transform and Load
The first step to populate my target structure is to unpivot the data so the questions are in rows. I’ll also replace the answer names and question sequence numbers with the ID from the dimension tables at the same time. The population count will go into answer ID 99 for now. This will produce an output like this.
The following (rather ugly) view will do this job. The inner query does the unpivot and the outer query gets the question and answer IDs.
CREATE view vw_nss_survey_2019
as

select q.question_id
, case sub.Metric
when '(4) Mostly Agree Count' then 2
when '(6) Not Applicable Count' then 6
when '(2) Mostly Disagree Count'then 4
when '(3) Neither Count' then 3
when '(1) Definitely Disagree Count' then 5
when 'Population (headcount)' then 99
when '(5) Definitely Agree Count' then 1
end answer_id
, Category course
, cnt

from
(
select category, metric, 1 qs, [1] cnt from ext.nss_survey_2019
union all select category, metric, 2 qs, [2] from ext.nss_survey_2019
union all select category, metric, 3 qs, [3] from ext.nss_survey_2019
union all select category, metric, 4 qs, [4] from ext.nss_survey_2019
union all select category, metric, 5 qs, [5] from ext.nss_survey_2019
union all select category, metric, 6 qs, [6] from ext.nss_survey_2019
union all select category, metric, 7 qs, [7] from ext.nss_survey_2019
union all select category, metric, 8 qs, [8] from ext.nss_survey_2019
union all select category, metric, 9 qs, [9] from ext.nss_survey_2019
union all select category, metric, 10 qs, [10] from ext.nss_survey_2019
union all select category, metric, 11 qs, [11] from ext.nss_survey_2019
union all select category, metric, 12 qs, [12] from ext.nss_survey_2019
union all select category, metric, 13 qs, [13] from ext.nss_survey_2019
union all select category, metric, 14 qs, [14] from ext.nss_survey_2019
union all select category, metric, 15 qs, [15] from ext.nss_survey_2019
union all select category, metric, 16 qs, [16] from ext.nss_survey_2019
union all select category, metric, 17 qs, [17] from ext.nss_survey_2019
union all select category, metric, 18 qs, [18] from ext.nss_survey_2019
union all select category, metric, 19 qs, [19] from ext.nss_survey_2019
union all select category, metric, 20 qs, [20] from ext.nss_survey_2019
union all select category, metric, 21 qs, [21] from ext.nss_survey_2019
union all select category, metric, 22 qs, [22] from ext.nss_survey_2019
union all select category, metric, 23 qs, [23] from ext.nss_survey_2019
union all select category, metric, 24 qs, [24] from ext.nss_survey_2019
union all select category, metric, 25 qs, [25] from ext.nss_survey_2019
union all select category, metric, 26 qs, [26] from ext.nss_survey_2019
union all select category, metric, 27 qs, [27] from ext.nss_survey_2019
) sub

join mis.mst.survey_questions q
on sub.qs = q.question_sequence
Note that the population metric (the number of students approached) is held under the answer ID 99 that I will use later to calculate non-responders.
Now I can populate the survey_responses fact table. First for those who responded:
--insert responders
insert into survey_responses
select question_id
, answer_id
, course
, cnt
from vw_nss_survey_2019
where answer_id != 99
And then to calculate the number that did not respond to the survey. As discussed these will get an answer of did not respond to every question. This is calculated but subtracting all responders from the population (which is recorded under answer ID 99):
--calculate non responders
insert into stu.survey_responses
select	question_id
,		7
,		course
,		sum(case when answer_id = 99 then cnt else 0 end) - sum(case when answer_id != 99 then cnt else 0 end) non_responders
from	vw_nss_survey_2019
where	answer_id is not null
group by question_id
,		course
Power BI Measures
Putting the tables questions, answers and responses into Power BI I can write the measures:
Agrees:=
    CALCULATE(      'Survey Responses'[Responses]
                ,   FILTER(     'Survey Answers'
                            ,   'Survey Answers'[answer_group_1] = "Agree"    )   )


Responded:=
    CALCULATE(      'Survey Responses'[Responses]
                ,   FILTER(     'Survey Answers'
                            ,   'Survey Answers'[answer_group_2] = "Responded"    )   )


Agrees %:= [Agrees]/[Responded]
Agrees % can be aggregated by question groups or for the whole survey. And it can be aggregated by any course hierarchy that the course code can be plugged into and compared to any other metrics in the Power BI model that are held at a course level. One thing is missing however. In the NSS only courses which reach a certain number responses are reported. This is in order to ensure anonymity but means I am missing all the responses that were for students in courses that didn’t meet the threshold. Since the NSS provides metrics for the whole survey however I can work out the difference between this and the course level data and record this under a course of “NA”.
I’ll add the whole survey data set to my view with a course of All:
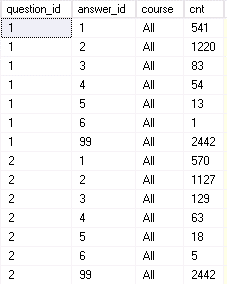
Now I can calculate the difference between the “All” course and all the other courses and add these to the survey_responses under a course of NA:
--calculate missing courses responses
insert into stu.survey_responses
select question_id
, answer_id
, 'NA' course
, sum(case when category = 'All' then cnt else 0 end) - sum(case when category != 'All' then cnt else 0 end) small_course_responders
from staging.ext.vw_nss_survey_2019
where answer_id != 99
group by question_id
, answer_id


--calculate missing courses non responders
insert into stu.survey_responses
select survey_id
, question_id
, 7 answer_id
, 'NA' course
, ( --university level non responders
sum(case when answer_id = 99 and category = 'UOW' then cnt else 0 end)
- sum(case when answer_id != 99 and category = 'UOW' then cnt else 0 end)
)
-
( --course level non responders
sum(case when answer_id = 99  and category != 'UOW' then cnt else 0 end)
- sum(case when answer_id != 99  and category != 'UOW' then cnt else 0 end)
) missing_course_non_responders
, null
from staging.ext.vw_nss_survey_2019
where answer_id is not null
group by question_id
Now the fact table contains all responses in the survey. Course is probably the most useful dimension to do this for but the process could be repeated for any of the other categories which the NSS is broken down by.