
In this section I’m going to create a new power BI custom visual that will display the Tree Funnel chart I designed in Part 2. For now, it will just use the fixed test data. I won’t bind it to an actual Power BI data source till the next instalment.
The complete code used in this section is available on GitHub.
The Microsoft documentation covers setting up the necessary development tools very clearly so I won’t rehash that here but I will quickly go over the main elements before moving my D3 chart into a Power BI visual.
The visual being developed will run in node.js so that is the first install. In addition, there are several pre-requisite node packages including the D3 library and the D3 Typescript definitions (Typescript is a Microsoft developed language that adds static typing to JavaScript). And the Power BI Visuals API definitions which provide all the classes for interacting with the visual. Also required is the pbiviz tool which will create and compile each visual project. I’ll be using Visual Studio Code for the IDE. Do note that in the Microsoft environment setup the D3 library version is 5.0 and I made the mistake of doing my initial D3 development on an earlier version so had to make a few changes to make it work in 5.0.
Once the environment’s all set up the first step is to create a new Custom Visual project. This is done by running the pbiviz new command which generates a new project folder containing a basic template for the visual. For the trunnel visual I’ll run the following in PowerShell to create the folder and open it as a project in Visual Studio Code
pbiviz new trunnel
cd trunnel
code .
The project folders will look something like this.
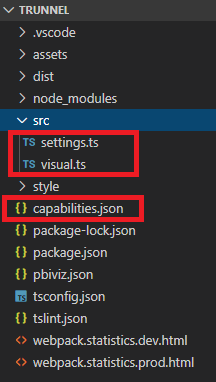
Everything in this section will happen in the visual.ts typescript file. This is the entry point for the visual and will contain the methods for displaying it. The other important files are settings.ts and capabilities.json which I’ll come on to when setting up data bindings and formatting options.
In visual.ts you must define a class that implements the IVisual interface. This implements a constructor which instantiates the visual and an update method which is called every time the visual needs to be re-rendered. In power BI the constructor is called once when the visual is added to the report canvas. The update method is called every time the visual is:
- Resized
- Has a formatting option changed
- Has data fields added or removed
- Has data refreshed
First off open up visual.ts and remove everything except the MIT License at the top and the “use strict” directive. And add the following modules:
import "core-js/stable";
import "./../style/visual.less";
import powerbi from "powerbi-visuals-api";
import VisualConstructorOptions = powerbi.extensibility.visual.VisualConstructorOptions;
import VisualUpdateOptions = powerbi.extensibility.visual.VisualUpdateOptions;
import IVisual = powerbi.extensibility.visual.IVisual;
import EnumerateVisualObjectInstancesOptions = powerbi.EnumerateVisualObjectInstancesOptions;
import DataView = powerbi.DataView;
import VisualObjectInstanceEnumerationObject = powerbi.VisualObjectInstanceEnumerationObject;
import IVisualHost = powerbi.extensibility.visual.IVisualHost;
import VisualObjectInstanceEnumeration = powerbi.VisualObjectInstanceEnumeration;
import * as d3 from "d3";
type Selection<T extends d3.BaseType> = d3.Selection<T, any, any, any>;
import { VisualSettings } from "./settings";
Next I’ll implement the IVisual interface in the class Visual.
export class Visual implements IVisual {

    private svg: Selection<SVGElement>;

    constructor(options: VisualConstructorOptions) {

        this.svg = d3.select(options.element)
            .append("svg")
            .classed("trunnel", true);

    }

    public update(options: VisualUpdateOptions) {}
}
The property svg will hold a reference to the top level SVG element on which the visual will be drawn which can be referenced in the update method. The constructor is called with the VisualConstructorOptions object. This includes the html element property to which we need to attach our top level SVG element. That’s all that’s required in the constructor for now – everything else happens in the update method which I’ll fill out now. This is called with a VisualUpdateOptions object which provides access to the visual data and other options. For now I’m going to use the test data from my D3 visual but I do want to access the visual dimensions. These will replace the hardcoded viewport dimensions from my D3 visual.
public update(options: VisualUpdateOptions) {

        // Set up the dimensions
        // var viewPortWidth = 1200
        // var viewPortHeight = 300
        var viewPortWidth = options.viewport.width;
        var viewPortHeight = options.viewport.height;
        // Size the svg to the viewport dimensions
        this.svg.attr("width", viewPortWidth);
        this.svg.attr("height", viewPortHeight);

}
Now I just need to add the rest of my existing D3 code in. Since Typescript is a superset of JavaScript I should be able to drop the code in pretty much as is. Well nearly, this line will fail.
var colourScale = d3.scaleLinear()
            .domain([0, items])
            .range(["Red", "Yellow"]);
Because the under the typescript definitions scaleLinear is expecting a number data type. This is easily fixed by explicitly stating the argument datatypes.
var colourScale = d3.scaleLinear<string, number>()
            .domain([0, items])
            .range(["Red", "Yellow"]);
Finally I need to change:
var chart = d3.select(".chart");

// To:

var chart = this.svg;
chart.selectAll("g").remove();
This selects the svg element to append to and removes all elements so it’s cleared every time the visual is updated.
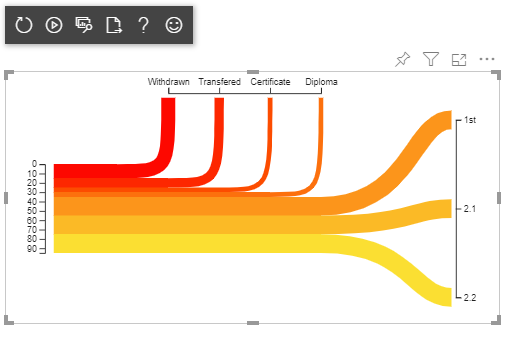
This should now display the fixed trunnel chart in Power BI so let’s try it. The easiest way to debug a custom visual is to use the Developer Visual. To do this you start your custom visual in node JS locally, edit a report in Power BI service and add the Developer Visual. This process is covered well in the Microsoft Tutorial so I won’t go over it again except to say it works very nicely: make changes to the project files in Visual Studio Code and these will be reflected in Power BI immediately and you can log debug information to the browser developer tools console. Alternatively you can package the visual into a pkviz file and import it into a report in Power BI Desktop or Power BI service to test it but this does not provide the editing and debugging options available via the Developer Visual.
So open the visual folder in PowerShell and run:
pbiviz start
Open a report in Power BI Service and add the developer visual. The visual will not be rendered until some data is added (even though it’s not being used at this stage) and will look like this:
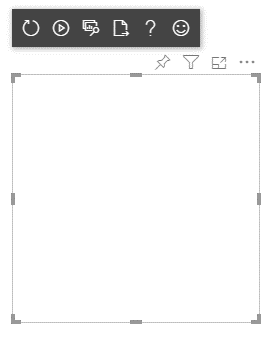
Add any Measure or Category data and the visual will be rendered. The visual will scale as it’s resized.
That’s it for this section. In the next part of this series I’ll remove the test data and bind the visual to the Power BI data source.